Subscribing to Deadcellzones is simple:
- Visit the Deadcellzones.com website.
- Use your Google account to sign in and start accessing the comprehensive cell phone dead zones database immediately.
Affordable Pricing
- $0.03 Per Day
- $1 Per Month for access to the Map Database
- 7-Day Risk-Free Trial: Try it out with no obligation and cancel anytime.
Why Choose DeadCellZones
Are dead zones, dropped calls, and slow data speeds frustrating you? DeadCellZones is your ultimate solution for staying connected wherever you go. We provide comprehensive coverage maps and insights into cellular service quality, ensuring you're always in the know about the best networks in your area.
- Accurate Coverage Maps: Our detailed maps pinpoint areas with poor coverage, so you can plan your routes and avoid dead zones.
- Carrier Reviews and Ratings: Get real-time reviews and ratings from users like you, helping you choose the best carrier for your needs.
- Community Insights: Join a community of users sharing their experiences and tips on improving connectivity.
Why Subscribe
- Exclusive Access: Subscribers enjoy exclusive access to map data, add new locations, and search the map.
- Updates: Receive alerts about network improvements, new cell tower installations, and special offers from carriers.
Join the DeadCellZones Community Today
Don't let poor connectivity hold you back. Join DeadCellZones today and experience a new level of connectivity awareness. Whether you're traveling, working, or at home, we're here to ensure you're always connected when it matters most.
Community Engagement
Join a community of drivers dedicated to identifying cell phone dead zone locations. Deadcellzones encourages user feedback and updates, ensuring the database remains robust and reflective of real-world conditions. We update our database daily, adding and removing locations as needed.
How To Purchase Data
Data Pricing
We sell our data at a rate of $.07 per record and offer various discounts for bulk data purchases and multi-year subscriptions. Please email us details on your regional data request for a pricing quote.
Buy Advertising
The website uses geotargeted advertising provided by Google Ads to serve up relevant ads that fit your profile. Please keep in mind that most of the ads you see on the website are not sold directly by us and are served up by Google, Bing & Yahoo based on your profile. If you or your company or organization is interested in advertising on the website(s) please contact us. We currently offer 3 advertising slots on the site that range in sizes from 300x250, 300x600, 728x90 banner.
Sponsorships
Sponsorships allow us to re-invest advertising dollars to support your campaign through social media. We buy advertising on your behalf and drive traffic in support of your organization.
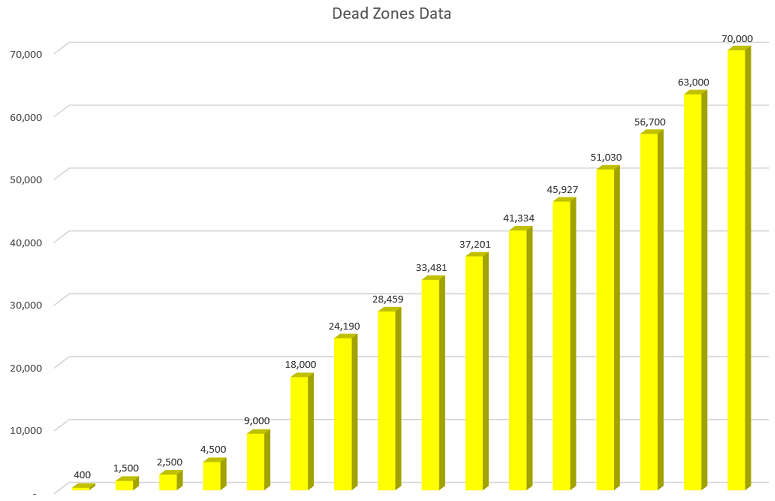
See the latest data summary totals by carrier below: